STA 303H1S / 1002HS -- Methods of Data Analysis II
-- Winter 2010
More SAS code (adding interaction and quadratic terms)
SAS output
More SAS code (adding predicted classification statistics)
SAS output
Plot of studentized residuals versus predicted values for diet HG (png)
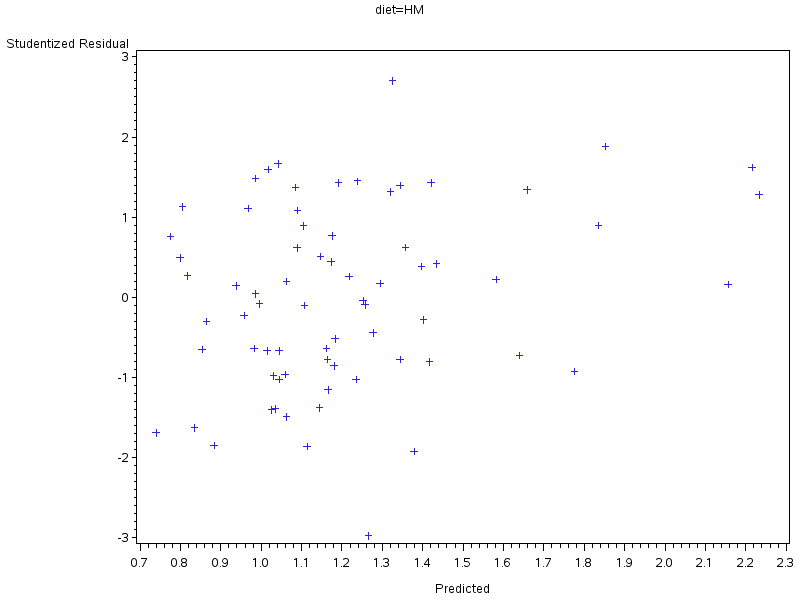
Plot of studentized residuals versus predicted values for diet HM (png)
Plot of studentized residuals versus predicted values for diet LG (png)
SAS code to fit different covariance structures for each diet
SAS output with different covariance structures for each diet
SAS code for AR(1) model
SAS output for AR(1) model
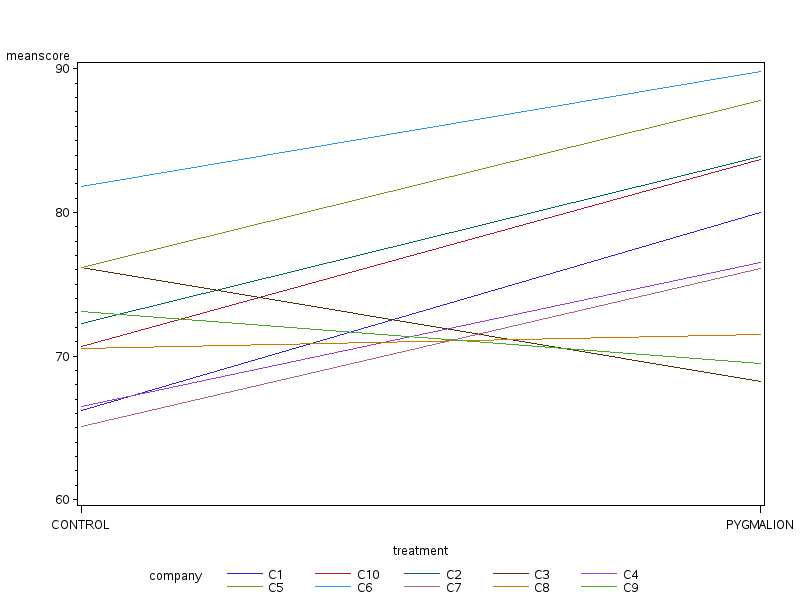
Plot of data with fitted model and trend line (png)